RESEARCH VISUALIZATION · Workflow idea

Make useful charts from public data—and keep the evidence in view.

For a researcher or publisher with a defined question and permitted public sources, collect relevant figures, organize them into a chart, and prepare an image for the media library. Keep citations and collection dates with the data, verify values and labels against original sources, explain gaps or uncertainty, and require an editor to approve the chart and its context before publication.

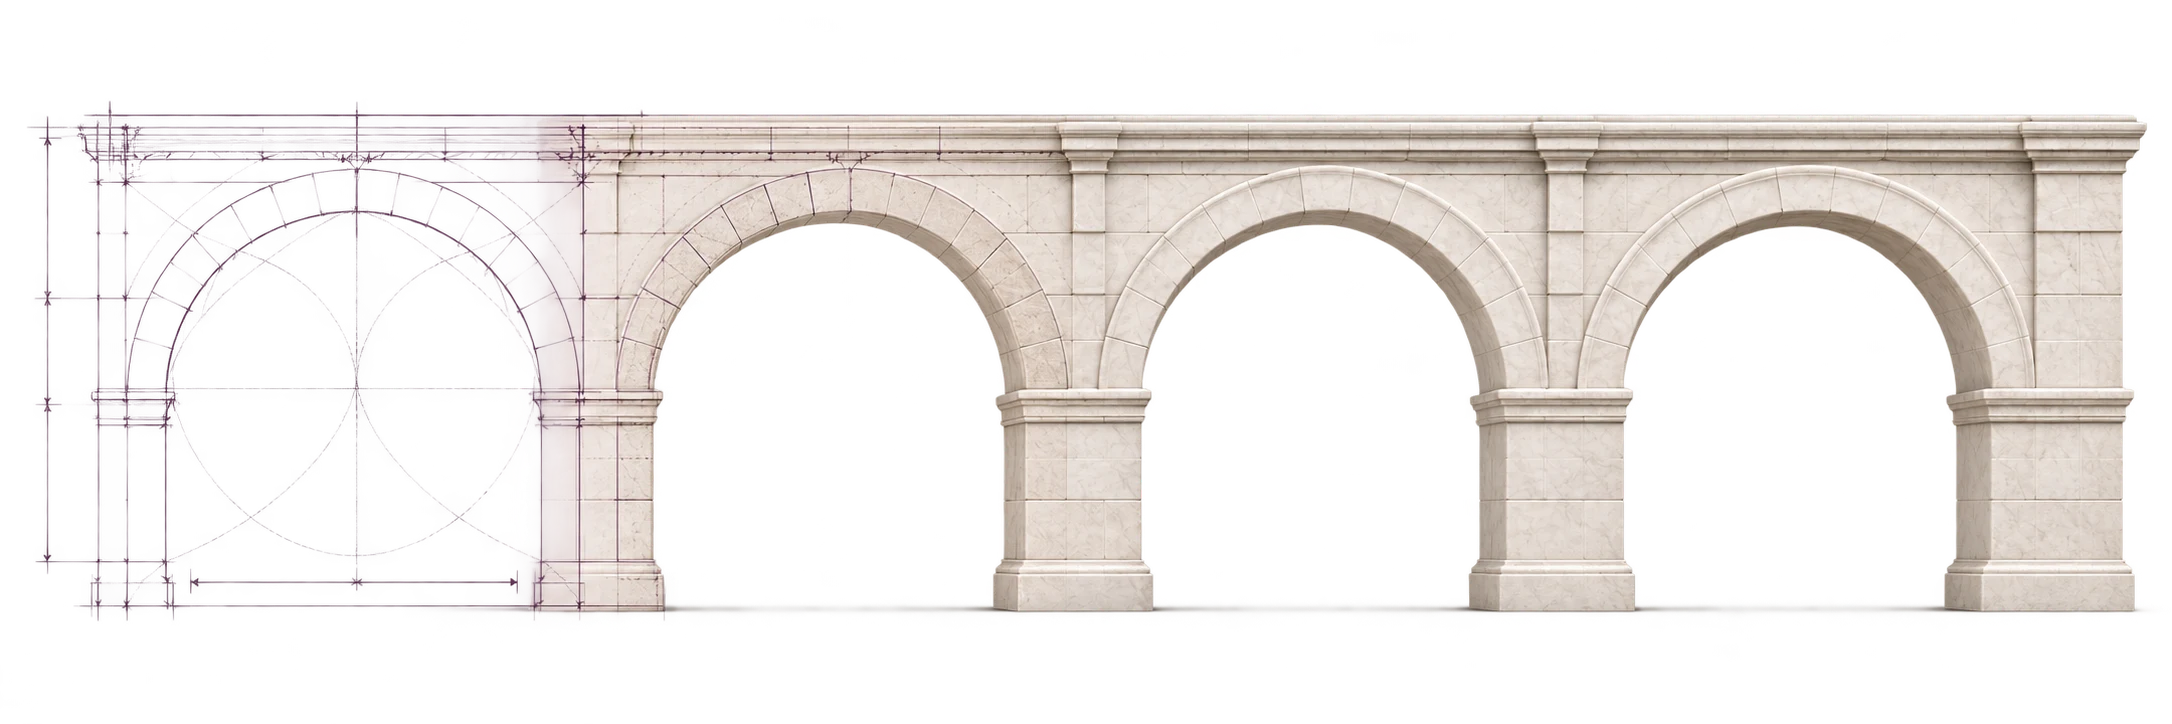
A Roman aqueduct taking shape from architectural sketch to marble.
A little structure. A clearer outcome.
Starts with
A researcher asks for a chart on a defined topic
Produces
A chart image and source-linked data table with verification notes and editor approval status.
Category
Reviews & approvals

01 / The starting point

A clear request.
A useful direction.

A research question, permitted public sources, and an approved publishing destination

“Create a readable visual without turning uncertain, outdated, or incomplete figures into an unsupported claim.”
An example request · Make it specific to your team.

02 / The work

5 tasks.
One useful outcome.

Helps a researcher organize public figures into a chart image and store it for later editorial use.

  1. Define the question and permitted sources

    Set the topic, time period, measures, and sources that are appropriate for the research purpose.

  2. Collect dated figures with citations

    Keep source links, collection dates, units, and relevant qualifications beside each value.

  3. Choose a chart that fits the evidence

    Select a clear visual form and label axes, units, categories, and reporting period accurately.

  4. Verify values and interpretation

    Compare data and calculations with original sources and flag gaps or non-comparable measures.

  5. Approve the image before publication

    Have an editor review the final chart, caption, sources, and intended audience.

03 / The result

Something useful.
Something to build on.

A chart image and source-linked data table with verification notes and editor approval status.

AmbactiWorkflow folio · 5 steps

Review a chart from public data

Reviews & approvals · Example outcome

The handoff

A chart image and source-linked data table with verification notes and editor approval status.

Keep in mind

Search results can be incomplete, measurements may not be comparable, and chart formats can distort meaning. Follow source terms, preserve dates and citations, check calculations and labels, and do not publish the image until an editor verifies the underlying evidence and intended context.

04 / Make it yours

Set the brief.
Set the standard.

A few choices shape the work around your team.

Document source terms and research scope

Use permitted public information and limit collection to the approved question.

Preserve citations, dates, and units

Keep enough context for a reviewer to reproduce and check the visual.

Set chart accuracy and accessibility checks

Review scales, labels, color contrast, alternative text, and the treatment of missing values.

Keep publishing behind editorial approval

Store drafts for review and require a person to approve the exact image and claims.

Put your next idea to work.

Start with your brief. Make the process your own.

Explore more workflows ↗